Last Updated: October 31, 2026
Quick Summary
To evaluate drip irrigation on managed farmland, check water quality, soil texture, emitter flow and pressure, and run field uniformity tests. Then review the maintenance log and a payback analysis built on your own measured baseline. A high uniformity score shows the system delivers water evenly across all trees.
- Request water tests from more than one time of year, since filters and emitters depend on water quality.
- Measure emitter flow and pressure in the field rather than relying only on manufacturer specifications.
- Aim for above roughly 85% distribution uniformity, and investigate any score below roughly 75%.
- Keep a dated maintenance log covering filter cleaning, emitter inspection, and leak repairs.
- Base any upgrade payback on a measured baseline and stress-test it with conservative assumptions.
Table of Contents
- Why Drip Irrigation Evaluation Matters on Managed Farmland
- Step 1: Assess Water Quality and Source Suitability
- Step 2: Evaluate Soil Texture and Root Zone Moisture
- Step 3: Measure Emitter Flow Rate and Operating Pressure
- Step 4: Run Irrigation Uniformity Testing Methods in the Field
- Step 5: Run a Drip Irrigation System Maintenance Checklist
- Step 6: Run a Cost-Benefit Analysis of Irrigation Upgrades
- Booking Your Farm Evaluation With RedGoldAgro
- Frequently Asked Questions
Why Drip Irrigation Evaluation Matters on Managed Farmland
Drip irrigation is one of the most closely watched parts of managed farmland. Its performance decides how much water reaches each tree, how evenly it is spread, and how much of it is actually used.
Demand for drip systems is growing. MarketsandMarkets estimates the U.S. drip irrigation market at $1,357.3 million in 2026 and projects it to reach $2,083.4 million by 2031, an 8.9% compound annual growth rate (MarketsandMarkets drip irrigation market report).
Drip irrigation is not automatically beneficial. University of Florida IFAS Extension advises growers to weigh both advantages and disadvantages, and notes that a properly designed, maintained, and operated system can be a real production asset (University of Florida IFAS Extension, drip-irrigation systems for small vegetable farms).
Keep two points in mind through the steps below:
- Water savings are real but depend on conditions. A 2024 review reports that drip irrigation can cut field water use by 30 to 50% compared with surface irrigation (2024 review of drip irrigation's effect on water and carbon fluxes). Results vary with soil, crop, and management.
- High efficiency can be lost to over-irrigation. A drip-system design case study notes that operators may not see the water being applied, which can lead to over-irrigation and erase the efficiency gains (design of a drip irrigation system case study).
This guide walks through seven steps to evaluate a drip system on managed farmland, each with a question to ask, a measurement to request, and a sign that something needs follow-up.
Step 1: Assess Water Quality and Source Suitability
Start with the water itself. Drip emitters have small openings, so sediment, algae, iron, and dissolved minerals can block them over time.
Ask for a water test covering pH, electrical conductivity, total dissolved solids, and any known problem minerals.
- Confirm the filter type and size match the water source.
- Check whether the filters can be flushed and cleaned without shutting down the whole field.
- Look for any sign of algae or biofilm in supply lines.
Watch out: A water sample taken once, in the dry season, may not reflect conditions during peak irrigation. Ask for results from more than one time of year.
Step 2: Evaluate Soil Texture and Root Zone Moisture
Soil decides how water moves. Sandy soils drain quickly and need more frequent, shorter irrigation.
Ask for a soil texture analysis from several points across the plot, not one sample. Then ask how the irrigation schedule accounts for the root zone.
- Compare the soil texture report with the design assumptions for emitter spacing and run time.
- Confirm that the probes are installed in representative locations, not only near the supply point.
- Ask how the soil moisture data is used to adjust scheduling.
Water-holding capacity matters for scheduling. If the design assumes a soil holds more water than it does, the system will either stress trees or overwater them.
Step 3: Measure Emitter Flow Rate and Operating Pressure
Emitter flow rate and operating pressure tell you whether the system delivers what the design promised. Flow rate is the volume each emitter releases, usually in gallons per hour.
Ask for a field test, not just the manufacturer's specification.
- Take readings from the start, middle, and end of each lateral line.
- Measure pressure at the inlet, the far end, and at least one point in between.
- Note any large drop in pressure across the field, which can point to undersized pipe or leaks.
A wide spread in emitter flow or pressure is the signal to look at. Small variation is normal; large variation usually means the design or installation needs attention.
Step 4: Run Irrigation Uniformity Testing Methods in the Field
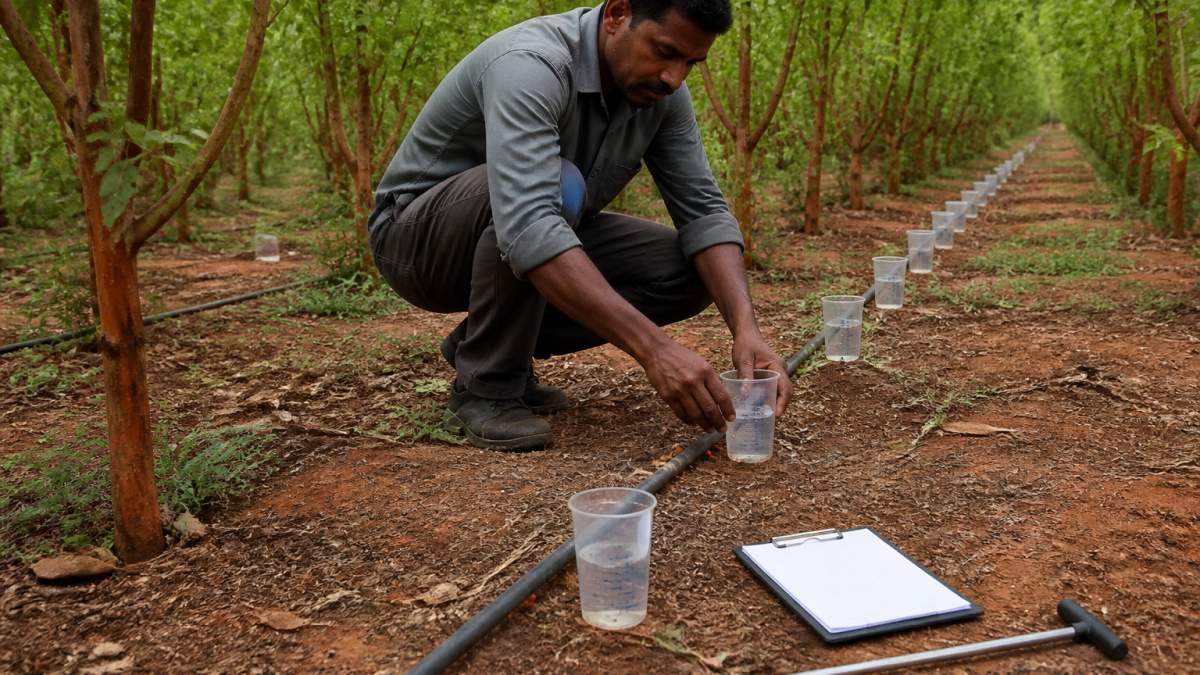
Uniformity testing answers the most important question: does every tree get roughly the same amount of water? The standard field method is a catch-can test, but the value comes from running it as a repeatable protocol rather than a one-off spot check, one a farm manager can hand to a field technician and get comparable results season after season.
A repeatable catch-can protocol
- Stratify the field before you sample. Divide the block into zones by soil texture, slope, and lateral length. Sample each zone separately; a single field-wide number can hide a dry corner or a waterlogged low spot.
- Pick representative laterals. In each zone, select at least three laterals: one near the supply point, one mid-block, and one at the far end. On sloped ground, add a lateral at the top and bottom.
- Space catch points along each lateral. Place identical containers at fixed intervals, commonly every 10 to 20 feet, including the first emitter, the last, and several in between. A workable minimum is 16 to 20 catch points per zone.
- Run the system at normal operating pressure for a fixed test period, typically 30 to 60 minutes. Record start and end times, and log pressure at the inlet and far end of each tested lateral.
- Measure and record. Pour each catch container into a graduated cylinder and record the volume in milliliters or fluid ounces. Note emitter spacing and the number of emitters feeding each catch point to convert to a per-emitter flow rate.
- Repeat in a second zone and, if the field has significant elevation change, a third. One zone is not a uniformity test; it is an anecdote.
Turning readings into a uniformity score
Calculate distribution uniformity (DU) by dividing the average of the lowest quarter of catch readings by the overall average, then multiplying by 100. A simpler coefficient of uniformity (CU) compares absolute deviations from the mean. Either way, the output is a percentage: higher means more even water delivery.
Use these practical thresholds as a starting point, not a rigid pass/fail:
- Above roughly 85% DU: the system is delivering evenly; keep monitoring.
- Roughly 75% to 85% DU: acceptable but worth investigating, check pressure variation and emitter clogging before the next season.
- Below roughly 75% DU: a real performance problem. Some trees are being overwatered and others shorted, and the cause needs to be diagnosed before scheduling changes will help.
Diagnosing a low score
A low uniformity number is a symptom, not a diagnosis. Connect it to the pressure readings you logged at the same time:
- Low pressure at the far end with good pressure at the inlet points to undersized pipe, excessive friction loss, or a partially closed valve. Check lateral diameter and run length against the design.
- Wide pressure swings across the zone suggest a pressure regulator that is failing or missing, or a zone that is too large for the supply.
- Even pressure but uneven catch volumes points to clogged or partially clogged emitters, especially if the low readings cluster at the end of laterals or in zones fed by poorer water.
Record the zone, date, pressure readings, catch volumes, and calculated DU in a log. Over two or three seasons, that log shows whether uniformity is stable, drifting downward from clogging, or improving after maintenance, exactly the evidence a farm manager needs to justify or reject an upgrade.
!Field worker placing catch cans along a drip line in a green orchard row, with a soil probe and clipboard on the ground
Pro Tip Ask the operator for the target uniformity the system was designed to, and for the last two seasons of test results. A system with no baseline and no target cannot be evaluated, only guessed at.Step 5: Run a Drip Irrigation System Maintenance Checklist
Even a well-designed system needs regular upkeep. Most performance problems on managed farms come from clogged emitters, leaking fittings, or filters that were never cleaned.
Ask for the maintenance log from the past season and a copy of the planned schedule.
- Filters flushed or cleaned on a fixed schedule, with dates logged.
- Emitters checked for clogging, with a sample inspected each season.
- Leaks and damaged lines repaired and recorded.
A checklist that is only written, never signed or dated, tells you little. Ask to see the records behind it.
Step 6: Run a Cost-Benefit Analysis of Irrigation Upgrades
Any upgrade to the irrigation system needs a clear financial case, and the case is only as good as the baseline it is measured against. The mistake most operators make is comparing a proposed upgrade to a general claim, "drip saves water", instead of to their own measured before-and-after numbers.
Define the baseline before you price anything
A usable baseline covers one full comparable season and includes:
- Water applied per acre, taken from meter readings or pump run-hours converted to volume, not from memory.
- Water productivity, expressed as yield or tree growth per unit of water applied, the metric that separates a real efficiency gain from a change in weather or crop load.
- Yield or quality outcomes, fruit size, grade, or tree caliper, measured the same way in both seasons.
Without a baseline, a payback estimate is a guess dressed up as a number.
Build the cost side
List every cost the upgrade carries, not just the equipment:
- Equipment and installation, including trenching, fittings, filters, and pressure regulators.
- Any pumping or energy change, a retrofit can raise or lower power demand depending on pressure requirements.
- Added labor for monitoring, filter flushing, and emitter inspection.
Build the benefit side
Tie benefits to the measured baseline rather than to headline figures:
- Water saved, valued at the actual water cost or pumping cost per acre-foot.
- Yield or quality gain, valued at the realized crop price, and tested at a lower price to see whether the case still holds.
- Reduced losses from uneven watering, estimated from the uniformity gap identified in Step 4.
Calculate payback and stress-test it
Divide the total upgrade cost by the annual net benefit to get a simple payback period in years. Then stress-test it: rerun the calculation with water costs 25% higher and lower, energy costs changed, and crop prices at a conservative level. If the payback only works under the most favorable assumptions, the upgrade is a bet, not a plan.
Watch Out Be cautious with any single headline figure. Gains reported in one study or region may not carry over to your land, which is why the field measurements from the earlier steps matter so much. A cost-benefit case built on someone else's numbers is not a cost-benefit case for your farm.A farm manager who can show a measured baseline, a full cost list, and a payback that survives conservative assumptions has something far more useful than a vendor's projection, a decision that can be defended to an investor, a lender, or a partner.
Booking Your Farm Evaluation With RedGoldAgro
Reading about these steps is useful, but the real test is the farm itself. You can contact RedGoldAgro to request a farm visit to Kanigiri and ask for the water, uniformity, and maintenance records covered above.
When you visit, bring the checklist from this guide. If you are planning your first trip, this list of practical questions for a first farm visit covers water, tree care, and ongoing management in more detail. Understanding managed Red Sandal farmland also explains the land ownership and plantation care context behind a long-term decision like this one.
Frequently Asked Questions
What are the key performance indicators for a drip irrigation system?
The main indicators are emitter flow rate, operating pressure, distribution uniformity, and water-use efficiency. Flow rate and pressure show whether each emitter delivers its rated output, while uniformity shows how evenly water reaches the root zone across the block. Tracking these against the manufacturer's specifications at installation gives you a baseline. Repeating the same measurements each season shows whether performance is declining from clogging, leaks, or pressure loss, and tells you when maintenance or redesign is needed.
How do you measure the uniformity of water distribution in drip irrigation?
Place catch containers at equal spacing along several laterals, including the first and last emitters on each line. Run the system for a set time, record the volume collected in each container, and calculate the distribution uniformity from the lowest-quarter average compared with the overall average. Compare the result against the design target for your system. Repeat the test at different pressure points if the field has elevation changes, since slope often causes uneven delivery.
What signs indicate a failing drip irrigation system on managed land?
Common signs include dry patches or unusually lush growth that does not match the layout, wet spots where water surfaces, falling flow rates at the end of laterals, and sudden drops in operating pressure. Visible emitter clogging, algae or mineral buildup in filters, and crop stress that appears unevenly across rows also point to problems. Soil moisture readings that vary widely within a single block suggest distribution problems rather than scheduling issues.
How often should drip irrigation systems be audited for efficiency?
A full audit is most useful at installation, at the start of each irrigation season, and after any major repair or change in water source. Simpler checks such as pressure readings, filter inspection, and visual emitter review can be done monthly during the active season. Keeping the same measurement points each time makes the results comparable across years and shows how the system is changing over time.
Download NRI Guide Add redgoldagro.com as a preferred source on Google →