Last Updated: November 7, 2026
Quick Summary
Evaluate tree survival reports by checking how the survival rate was calculated, how plots were sampled, and whether live, dead, and missing trees are counted separately. A verifiable report states the planting date, species, sample size, inspection dates, and photographs. Compare survival across inspection dates and by cohort before relying on any single percentage.
- Divide living trees by the number originally planted, then multiply by 100.
- State the number of sample plots, plot size, and how plots were placed.
- Count live, dead, and missing trees separately in every plot.
- Compare survival across inspections using the same plots and method.
- Request cohort and species breakdowns before drawing conclusions about the plantation.
Table of Contents
- Why Tree Survival Reports Matter for Plantation Investors
- How to Calculate Tree Survival Rate Correctly
- Step 1: Check the Field Sampling Method and Sample Size
- Step 2: Verify Counts of Live, Dead, and Missing Trees
- Step 3: Use a Monitoring Report Template to Check Completeness
- Step 4: Compare Survival Trends Across Monitoring Intervals
- Your Next Step: Requesting Verifiable Survival Data Before You Invest
- Frequently Asked Questions
Why Tree Survival Reports Matter for Plantation Investors
If you are weighing a managed plantation investment, the survival report is often the first document that tells you whether the trees are actually there. A plantation that looks healthy on a brochure can still hide a large number of dead or missing trees. Reading a survival report carefully is how you tell the difference.
Survival data matters because young trees are vulnerable. Forestry guidance treats establishment as the riskiest period in a plantation's life, and mortality is relatively high during this phase, according to a U.S. Forest Service study of establishment success in urban tree case studies. A report that shows strong survival early on is good news, but only if the method behind it is sound.
Survival is also only one part of the picture. The Arbor Day Foundation describes plantation progress in terms of tree health, growth, and community impact, not survival alone, as explained in Arbor Day Foundation's guide on measuring progress. Treat a survival figure as a starting point for questions, not a final verdict.
- Ask how the survival figure was calculated
- Ask when the count was taken
- Ask whether the count covered the whole plantation or a sample
How to Calculate Tree Survival Rate Correctly
The basic formula is simple: divide the number of living trees by the number originally planted, then multiply by 100. A plantation with 900 living trees out of 1,000 planted has a 90% survival rate.
The formula only works if the inputs are right. Common errors include:
- Using the number of seedlings bought instead of the number planted
- Counting trees that died after the last inspection
- Leaving out replanted trees, which can inflate or distort the rate
- Mixing species or planting cohorts into one number
Watch out: A survival rate can look strong even when a key species is failing. Always ask for results broken down by species and planting date.
When a report gives a survival rate, check that the denominator matches the planting record. If it does not, the percentage is not reliable.
Step 1: Check the Field Sampling Method and Sample Size
Most survival reports do not count every tree. They count a sample of plots and estimate the rest. That is normal, but the sampling method must be stated clearly enough that you can judge whether the estimate is trustworthy.
Look for these details in the report:
- The number and size of sample plots
- How plots were placed across the plantation (random, systematic, or fixed)
- The total area covered by the sample
- The date of each count
- Whether the same plots were used in previous inspections
A sample that covers only one corner of the plantation can miss problem areas entirely. If the report does not explain how plots were chosen, ask for that information before you rely on the numbers.
How to judge whether a sample is large enough
There is no universal sample size that fits every plantation, but a few practical rules help. First, the sample should cover a meaningful share of the planted area, commonly at least 5% to 10% for a basic survival estimate, and more when the plantation is young or variable. Second, the number of plots should be large enough that a single poor plot does not swing the overall rate by more than a few percentage points. Third, the report should state the sampling intensity (sample area divided by total planted area) so you can compare it with other projects.
Watch out: A report that gives a survival percentage without stating the number of plots, plot size, or sampling intensity cannot be audited, no matter how precise the percentage looks.
Avoiding biased sampling
Representative sampling means every part of the plantation has a known chance of being included. Fixed plots placed only along access roads, or plots chosen by the manager after a visual walk, tend to over-represent healthy areas. Random or systematic grid placement is more defensible. Ask whether plot locations were recorded with GPS coordinates or marked on a map, if they were not, the sample cannot be reproduced in the next inspection.
Reporting uncertainty
A survival rate from a sample is an estimate, not a census. Good reports include a simple measure of uncertainty, such as a confidence interval or a range. For example, a report might state that survival is 85% with a 95% confidence interval of 80% to 90%. If the interval is wide, the true survival could be much lower than the headline number. When a report gives only a single percentage with no range, treat it as a point estimate and ask for the underlying plot data so you can assess variability yourself.
Mississippi State University Extension offers a sampling approach for evaluating new plantations and notes that young pine plantations below 300 to 350 surviving trees per acre are considered failures for sawtimber production, as described in MSU Extension guide to inspecting new plantations. That threshold applies to pine sawtimber, not to every species, so use it only as an example of how a benchmark should be tied to a specific purpose and a specific sample design.
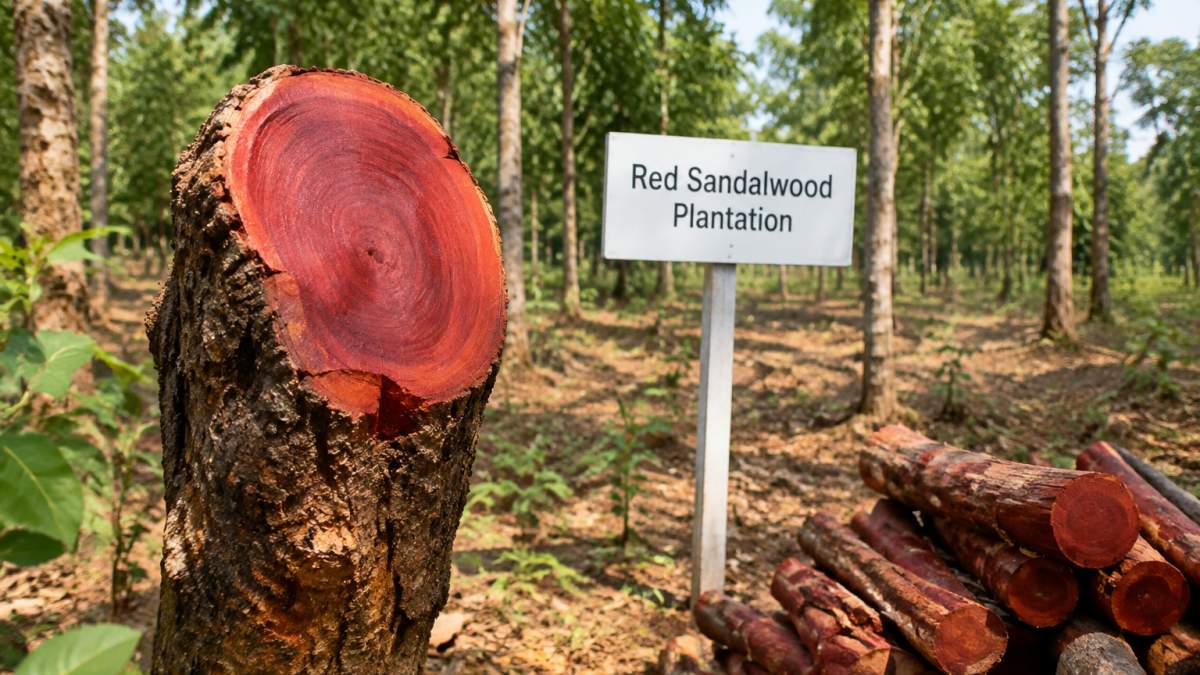
If the report does not explain how plots were chosen, how many were measured, and how uncertain the estimate is, ask for that information before you rely on the numbers.
Step 2: Verify Counts of Live, Dead, and Missing Trees
A good report separates three groups:
- Live trees: Standing and showing healthy growth
- Dead trees: Clearly dead, usually with no green tissue
- Missing trees: Not found at the expected location
Missing trees are the group most often ignored. A tree that has disappeared may have died, been removed, or never been planted. Reports that combine dead and missing trees hide useful information.
Field photographs help confirm the counts. Ask whether repeat photos exist for the sampled plots.
- Check that live + dead + missing equals the total planted in each plot
- Look for any plot where the totals do not add up
- Ask who did the count and whether they were independent of sales
Step 3: Use a Monitoring Report Template to Check Completeness
A complete survival report includes a set of basic fields. Use this checklist to see what is missing:
- Planting date and planting method
- Species and seedling source
- Total number of trees planted
- Plot size, number of plots, and plot locations
- Counts of live, dead, and missing trees by plot
- Survival percentage with the formula used
- Date of each inspection
- Notes on causes of mortality or replanting
- Photographs or other evidence of the counts
If more than two or three items are missing, the report is not yet verifiable. Request the full template before comparing it with other projects.
Step 4: Compare Survival Trends Across Monitoring Intervals
One survival number tells you little. Two or more numbers over time tell you whether the plantation is improving or declining, but only if you compare them correctly.
Use the same plots and the same method
Trends are only meaningful when the sample is held constant. If the report uses different plots or a different plot size in each inspection, a change in survival may reflect the sampling, not the trees. Ask whether the same plot locations were revisited. If plots were added or dropped, ask why and how the report accounts for the change.
Account for different assessment dates
Inspections rarely fall on the same calendar day each year. A count taken in a dry month may show lower survival than one taken after seasonal rains, even if no trees actually died. Note the date of each inspection and whether the report explains any seasonal effect.
Compare cohorts, not just totals
A single overall survival rate can hide the fact that one planting cohort is failing while another thrives. Ask for results broken down by planting date, species, and site block. A cohort planted in a dry year may show 70% survival while a later cohort shows 95%; the overall average of 82% tells you nothing about where the problem lies.
Watch out: A report that shows only a single overall survival figure for all cohorts and species cannot reveal hidden failures, request the breakdown before drawing conclusions.
Plot the trend and flag sharp drops
List the survival rate at each inspection date alongside the sample size and the assessment date. A sharp drop between two reports is a signal to ask what happened, pest outbreak, drought, replanting failure, or a change in counting method.
Research on urban tree establishment has tracked mortality between the third and fourth summers after planting, which shows that survival can change considerably in later years. A 2026 study in Arboriculture & Urban Forestry reported a mortality rate of 3.5% in that period, based on street-level imagery, as described in Arboriculture & Urban Forestry 2026 study on virtual tree survival tracking.
- Plot the survival rate at each inspection date with the sample size
- Flag any sharp drop and ask what action followed
- Request cohort-level and species-level breakdowns
- Check that assessment dates and intervals are comparable
When you can see survival trends by cohort and species, you can judge whether the plantation is on a stable path or whether corrective action is needed before the next reporting period.
Your Next Step: Requesting Verifiable Survival Data Before You Invest
Before you commit money, request the raw data behind any survival claim. A reputable manager should be able to provide plot-level counts, the sampling method, inspection dates, and photographs.
Here is what to ask for:
- The full monitoring report, not a summary page
- Plot-level counts with live, dead, and missing trees
- The survival formula and sample size
- A history of inspections over time
- A site visit, or a video walkthrough if a visit is not possible
If you want to go further, read our checklist for NRI investors evaluating farmland on the questions to raise with independent advisers. Use Contact RedGoldAgro to request verifiable survival data for the Kanigiri, Andhra Pradesh site. You can also review our About RedGoldAgro page for an overview of the managed Red Sandal farmland offering.
Survival reports are only useful when you can check them. Ask for the data, test the numbers, and do not invest on a percentage alone.
Frequently Asked Questions
How do you calculate a tree survival rate?
Divide the number of living trees counted in your sample plots by the number of trees originally planted in those same plots, then multiply by 100 to get a percentage. Count only trees that are alive at the assessment date, and record missing trees separately so they are not confused with dead ones. Always state the assessment date, the plot count, and the planting density alongside the figure. A single percentage means little without these details, so check that the report provides them before relying on the result.
What sampling method is reliable for evaluating plantation survival?
A systematic or randomized set of sample plots is more reliable than walking a few convenient rows. The report should describe how plots were located, how many were measured, and what fraction of the total planted area they represent. Plots should be spread across different parts of the site, including slopes, soil types, and access points. If a report samples only the best-looking section of a plantation, its survival figure will overstate performance across the whole property.
How should missing or dead trees be handled in a survival report?
Missing trees, meaning those that cannot be located, should be reported as a separate category from confirmed dead trees. Treating missing trees as alive inflates survival, while treating them as dead without evidence can understate it. A credible report explains how missing trees were identified, whether replanting occurred, and how replacements are counted. Ask for the number of replacements and whether they are included in the survival percentage or reported separately.
 Add redgoldagro.com as a preferred source on Google →